Paper 2: Strategic Growth and Spatial Distribution Options
Growth Options (Levels of Growth 2018 - 2033)
5.1 This section presents six options for growth over the RLDP period (2018 - 2033). For each option a figure is given for both the number of new homes and the anticipated number of new jobs over the RLDP period of 15 years (Refer to Table 1). This section should be read alongside the BP01 - Growth Level Options Report and BP18 - Conwy Employment Land Review, which includes an assessment of the impact from Regional Economic Drivers identified in the North Wales Growth Deal and Conwy Economic Strategy.
Current Planning Policy Wales (PPW Edition 9) states at Para 9.2.2 that....the latest Welsh Government local authority level Household Projections for Wales, alongside the latest Local Housing Market Assessment, will form part of the plan's evidence base together with other key issues such as what the plan is seeking to achieve, links between homes and jobs, the need for affordable housing, Welsh language considerations, the provisions of corporate strategies and the deliverability of the plan. Household projections provide estimates of the future numbers of households and are based on population projections and assumptions about household composition and characteristics.
Draft PPW (Edition 10) states at Para 3.24 that.......the latest Welsh Government local authority level Household Projections for Wales, alongside the latest Local Housing Market Assessment (LHMA) and the Well-being plan will form part of the evidence base for the plan. These should be considered together with other key issues such as what the plan is seeking to achieve, links between homes and jobs, the need for affordable housing, Welsh language considerations and the deliverability of the plan. Taking into account the wider economic, social, cultural and environmental factors is a vital part of identifying the housing requirement to create sustainable places and cohesive communities.
In addition, Carl Sargent (Former Minister for Natural Resources) has clarified in his letter of 10 April 2014 that Local Planning Authorities must provide for a level of housing that is based upon all sources of evidence rather than just Welsh Government (WG) household projections. The Council is therefore required to determine this figure based on the emerging evidence base and a variety of relevant issues and considerations. For example, the growth options need to consider how they can contribute sustainably to delivering the jobs requirement and the affordable housing needs identified in the LHMA. In addition, the growth options need to be considered against past delivery and the overall capacity of the construction industry to deliver growth. Such detail will inform the preferred growth option to be consulted on at a later stage in July 2019.
No single growth option is considered preferable at this stage. The figures presented provide an indication of the scale of growth the LDP will potentially need to address, in accordance with demographic statistics and evidence base. It should be noted however that data sets are continually being updated and the emerging plan strategy will need to be flexible enough to allow the LPA to respond to changing demographic circumstances should new household projections and/or economic information become available over the course of the plan preparation.
Table 1 shows the options for the level of housing and employment development that the Plan will need to provide for.
The growth scenarios outlined are based on established data sources and reasoned assumptions on possible future trends. Altogether we have looked at sixteen different growth scenarios - nine based on population change, five based on housing change, and two based on economic/employment change. More information about these projections and the criteria they were judged against are set out in BP01.
After this first round of evidence gathering and analysis, the following scenarios were initially selected for consideration for inclusion in the key stakeholder consultation. A brief assessment of each option is provided below along with a summary of the shortlisted options (Table 1 & 2). Chart 1 below illustrates the growth scenarios alongside other comparative data such as the Council's housing delivery completions from 2017/18, the highest completion rate set in 2007/08 and current LDP annual housing requirements figure.
Table 1: Summary of Shortlisted Growth Options
|
Growth Option |
Level of Housing & Employment Growth |
Evidence Base Used |
|
Option 1 - Population led growth scenario (2017-based 15 year migration trend - Welsh Government methodology |
Employment - -600 (-4.0 ha) Housing - 1,800 (120 p/a) |
2017-based 15 year migration trend - Welsh Government methodology* |
|
Option 2: Population led growth scenario (2017-based 10 year migration trend - propensity methodology |
Employment +750 (+5.2 ha) Housing - 4,050 (270 p/a) |
2017-based 15 year migration trend - Welsh Government methodology* |
|
Option 3: Population led growth scenario (2017-based 15 year migration trend - propensity methodology) |
Employment +1,450 (+10.2 ha) Housing - 4,950 (330 p/a) |
2017-based 15 year migration trend - Welsh Government methodology* |
|
Option 4 - Employment led projection - Conwy Employment Land Review 'Policy On' projection of 1,850 additional jobs |
Employment +1850 (12.6 to 14.3 ha) Housing - 5,250 (350 p/a) |
Conwy Employment Land Review (ELR 2018) North Wales Growth Deal |
|
Option 5 - Employment led projection - Conwy Employment Land Review Conwy Economic Strategy projection of 3,500 additional jobs |
Employment +3500 (18.8 to 24.5 ha) Housing - 7,150 (480 p/a) |
Conwy Economic Growth strategy North Wales Growth Deal |
|
Option 6 - Housing led projection - LHMA affordable housing requirement (based on 20% affordable housing contribution |
Employment - Not Applicable (Refer to summary below) Housing - 17,300 (1,150 p/a) |
Conwy Local Housing Market Assessment Affordable Housing Viability Assessment |
*Consideration has also been given to the Conwy Employment Land Review (ELR) 2018 - 2033), Conwy Economic Drivers Review (2018 - 2033) and Conwy Local Housing Market Assessment.
Option 1 - Population led growth scenario
(2017-based 15 year migration trend - Welsh Government
methodology
This option is based on an update of the official
2014-based projections, using exactly the same methodology
but data updated for the most recent year of population
that is available (2017) where appropriate, and extending
the trend period to 15 years, to more closely match the
length of the RLDP period (2018 - 2033). The migration
trend is based on data for the 15 years between 2002/2003
and mid 2016/2017.
This scenario is included as it allows comparison with the
officially produced projections which are suggested as a
key part of the evidence that should be taken into account
when formulating future growth strategies for the RLDP
.
In this scenario, though population growth and dwelling
requirements broadly match the trends seen in 2011- and
2014-based Welsh Government projections and other
population evidence, the impact of the large baby-boomer
generation moving out of the working age population is seen
in the economic impacts section of table 2 below, which
undermine aspirations for jobs growth and economic
aspirations in the County Borough.
Option 2 - Population led growth scenario
(2017-based 10 year migration trend - propensity
methodology)
This scenario uses the same assumptions about fertility,
mortality and household formation as the option 1
population led growth scenario (and thus has many
similarities with the official Welsh Government methodology
for producing population led projections). However, instead
of using fixed migration totals for population growth in
future years, it works on a propensity model which
calculates a likelihood of migration by age/sex based on
the overall population profile of the area and, in the case
of UK in-migration, the country as a whole.
It uses a 10 year migration trend based on data for the 10
years between 2007/2008 and mid 2016/2017. A 10 year
migration trend was used for the official Welsh Government
2014-based projections.
This scenario produces a higher level of overall population growth than option 1, which leads to a higher dwelling requirement (about 4,050 new dwellings over the plan period or an average of about 270 each year), and allows for economic growth of about 5.2 ha of employment land for 750 new jobs over the Plan period (additional employment land may be needed for replacement or expansion of existing sites).
Option 3 - Population led growth scenario
(2017-based 15 year migration trend - propensity
methodology)
This scenario has the same methodology as option 2, but
uses a 15 year migration trend based on data for the 15
years between 2002/2003 and mid 2016/2017.
This scenario gives higher levels of population and housing
growth than option 2 (about 4,950 new dwellings over the
plan period or an average of about 330 each year), but is
still within the range of recent housing completions
figures. It also sees growth in the working age population
that helps match aspirations for economic growth for the
region , suggesting a need for employment land of about
10.2 ha for 1,450 new jobs over the Plan period (additional
employment land may be needed for replacement or expansion
of existing sites). Along with other policy approaches to
improve the delivery of affordable housing (refer to Topic
Paper 1 Housing), this option also contributes
approximately 1000 new affordable housing units over the
RLDP based on a crude across the board 20% contributions
from housing schemes. Topic Paper 1 is also exploring other
ways to improve the delivery of affordable housing via
various land use and policy mechanisms, the results of
which will inform the RLDP Preferred Strategy at a later
stage. Further viability work is currently underway via
BP10 - Affordable Housing Viability Study, which will also
inform future policy.
Option 4 - Employment led projection (Conwy
Employment Land Review 'Policy On') 1,850 additional
jobs
This 'policy on' growth option of 1,850 jobs is proposed in
the Conwy Employment Land Review (ELR) and is based on an
assessment of the regional economic drivers identified in
the North Wales Growth Deal. The methodology for this
growth scenario is different from the traditional
projections methodology used in options 1, 2 and 3.
Population, household and dwelling impacts are calculated
by using a backward iteration methodology which adjusts
components of population change (mainly migration levels
amongst the working age population and their dependents) to
match jobs growth to population growth levels.
This scenario sees similar levels of overall growth to those seen in option 2. It gives dwelling growth within the range of recent completions figures (about 5,250 new dwellings over the Plan period or an average of about 350 each year). Jobs growth of 1,850 helps match aspirations for economic growth for the region, suggesting a need for around 12.6 - 14.3 ha of employment land for new jobs over the Plan period (additional employment land may be needed for replacement or expansion of existing sites).
Option 5 - Employment led projection (Conwy
Economic Strategy) - 3,500 additional jobs
This option is based on an aspirational jobs growth of
3.500 as set out in the Conwy Economic Growth Strategy,
which is informed by the North Wales Growth Deal. It uses
the same methodology as for option 4 but with a level of
jobs growth that is about twice the figure seen in that
option.
This scenario sees levels of overall growth that are higher than options 1 - 4. It gives dwelling growth which is significantly higher than the levels of housing completions that have been achieved in recent years (about 7,150 new dwellings over the Plan period or an average of about 480 each year). Jobs growth of 3,500 suggests a need for around 18.8 to 24.5 ha of employment land for new jobs over the Plan period (additional employment land may be needed for replacement or expansion of existing sites).
Option 6 - Housing led projection - LHMA affordable
housing requirement
This option uses the affordable housing needs calculation
from the Local Housing Market Assessment as its starting
point. The version presented in this paper uses the
joint-housing register (SARTH) from April 2018 as the main
component of the calculation.
The annual need figure from this calculation was calculated as around 190 households a year (slightly lower than in the 2017 Local Housing Market Assessment). This calculates to a total requirement over the RLDP period of 2850 affordable units. If a level of 20% deliverability is set on total housing development in order to achieve this level of affordable housing, then around 960 dwellings would need to be built each year to meet this level of need. Once a contingency is added to this figure the total annual requirement is around 1,150, which is more than three times the highest level of new housing completions in Conwy County Borough in the last ten years. After seeing the high dwelling impact for this projection (and others based on the same methodology), it was decided to present the figures as evidence in the key stakeholders consultation background papers, but not to pursue this option as a potential growth scenario as dwelling figures of this magnitude would be a significant challenge to deliverability and sustainability goals.
The affordable housing needs calculation of 2850 (190 a year) looks at current and potential future affordable housing need, and calculates an annual estimate of how many households will require help to access affordable housing in addition to households who are already being helped.
It is important to note that the 'bottom line' affordable housing need figure isn't simply about the requirement to build new homes - it's about households in need. As well as providing new affordable housing, there are a variety of other ways of helping these households which don't require new building - for example through placement within existing social housing stock; the provision of supported purchase schemes such as that provided through the First Steps register; the conversion or adaptation of existing stock to better meet tenants' needs (from stock within both the social sector and the private sector) and through financial support to rent within the private sector (housing benefit). Though some households identified as being in need of help to access affordable housing will be currently without a home, most will have accommodation, albeit in inadequate housing. This does not negate the need to provide a significantly greater number of affordable housing options (particularly as housing costs continue to rise and those with lower incomes are squeezed out of market), but suggests that methods other than building new housing for social and intermediate tenure need to be employed to meet this need. This may include seeking to influence the type of housing that is built to make it more suitable to those who could potentially be housed in market housing if adequate and appropriate housing was available (for example, encouraging builders to provide more smaller dwellings or to apply 'homes for life' standards). Further assessment of the new build need will be undertaken in BP/11 'Affordable Housing Needs Calculation'
Chart 1: Dwelling requirement - annual average for
selected growth scenarios for Conwy CBC replacement LDP
2018 to 2033, with comparative data
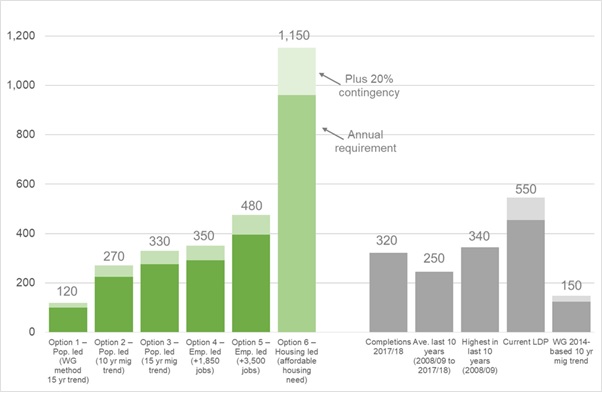
Table 2 Summary of change for selected growth scenarios for Conwy CBC replacement LDP 2018 to 2033
|
Option 1 |
Option2 |
Option 3 |
Option 4 |
Option 5 |
Option 6 |
|
|
Household growth |
1,350 |
3,100 |
3,750 |
4,000 |
5,400 |
- |
|
Dwelling impacts - change 2018-2033 |
||||||
|
Households to dwellings |
1,500 |
3,400 |
4,100 |
4,400 |
5,950 |
14,400 |
|
Plus contingency |
300 |
680 |
820 |
880 |
1,190 |
2,880 |
|
Total |
1,800 |
4,050 |
4,950 |
5,250 |
7,150 |
17,300 |
|
Annual figure |
120 |
270 |
330 |
350 |
480 |
1,150 |
|
Housing land requirements - change 2018-2033 |
||||||
|
Existing supply |
2,650 |
2,650 |
2,650 |
2,650 |
2,650 |
2,650 |
|
New allocations required |
-900 |
1,400 |
2,300 |
2,600 |
2,600 |
14,650 |
|
Economic impacts - change 2018-2033 |
||||||
|
Jobs growth |
-600 |
750 |
1,450 |
1,850 |
3,500 |
- |
|
Land (ha) |
-4.0 |
5.2 |
10.2 |
12.6-14.3 |
18.8-24.5 |
- |
Option 1: Population led growth scenario (2017-based 15
year migration trend - Welsh Government methodology)
Option 2: Population led growth scenario (2017-based 10
year migration trend - propensity methodology)
Option 3: Population led growth scenario (2017-based 15
year migration trend - propensity methodology)
Option 4: Employment led projection - 1,850 additional
jobs
Option 5: Employment led projection - 3,500 additional
jobs
Option 6: Housing led projection - LHMA affordable housing
requirement
As numbers are only a projection of future requirements and
are not an exact count, the results are rounded to the
nearest 50 for publication, except for projected annual
dwelling requirements, which are rounded to the nearest
10.
Figures are for the whole of Conwy County Borough,
including that part of the area which is within the
jurisdiction of the Snowdonia National Park Local Planning
Authority .
(3) Question 3: Do you agree with the figures and rationale for Growth Option 1?
(3) Question 4: Do you agree with the figures and rationale for Growth Option 2?
(3) Question 5: Do you agree with the figures and rationale for Growth Option 3?
(3) Question 6: Do you agree with the figures and rationale for Growth Option 4?
(3) Question 7: Do you agree with the figures and rationale for Growth Option 5?
(3) Question 8: Do you agree with the figures and rationale for Growth Option 6?
(1) Question 9: What is your preferred growth option as detailed in the options above?
(1) Option 3
(5) Option 4
(3) Option 5
(4) Question 10: Are there any other options we should include?